
Preparing your Organization for an Enterprise-wide RPA Initiative
A step-by-step guide for managing all the essential processes across an enterprise. A necessary precondition for the strategic introduction of RPA at-scale within the organization.

Introduction
Robotic Process Automation (RPA) can bring immense benefits to an organization. However, the journey to a successful RPA implementation on an enterprise-scale is built on a foundation of process modeling, model inventorying, and model simulation of the organization’s business processes. This foundation allows management to gain a full understanding of where the inefficiencies and bottlenecks in their business processes lie. It is only when management is armed with this data that they should then decide on how and where to strategically introduce RPA at-scale within the organization. In this article we provide a step-by-step guide on how to lay this foundation.
While organizations can jump straight into implementing RPA, we do not recommend that unless they have first followed the steps discussed below.
Step 1. Identify your Processes
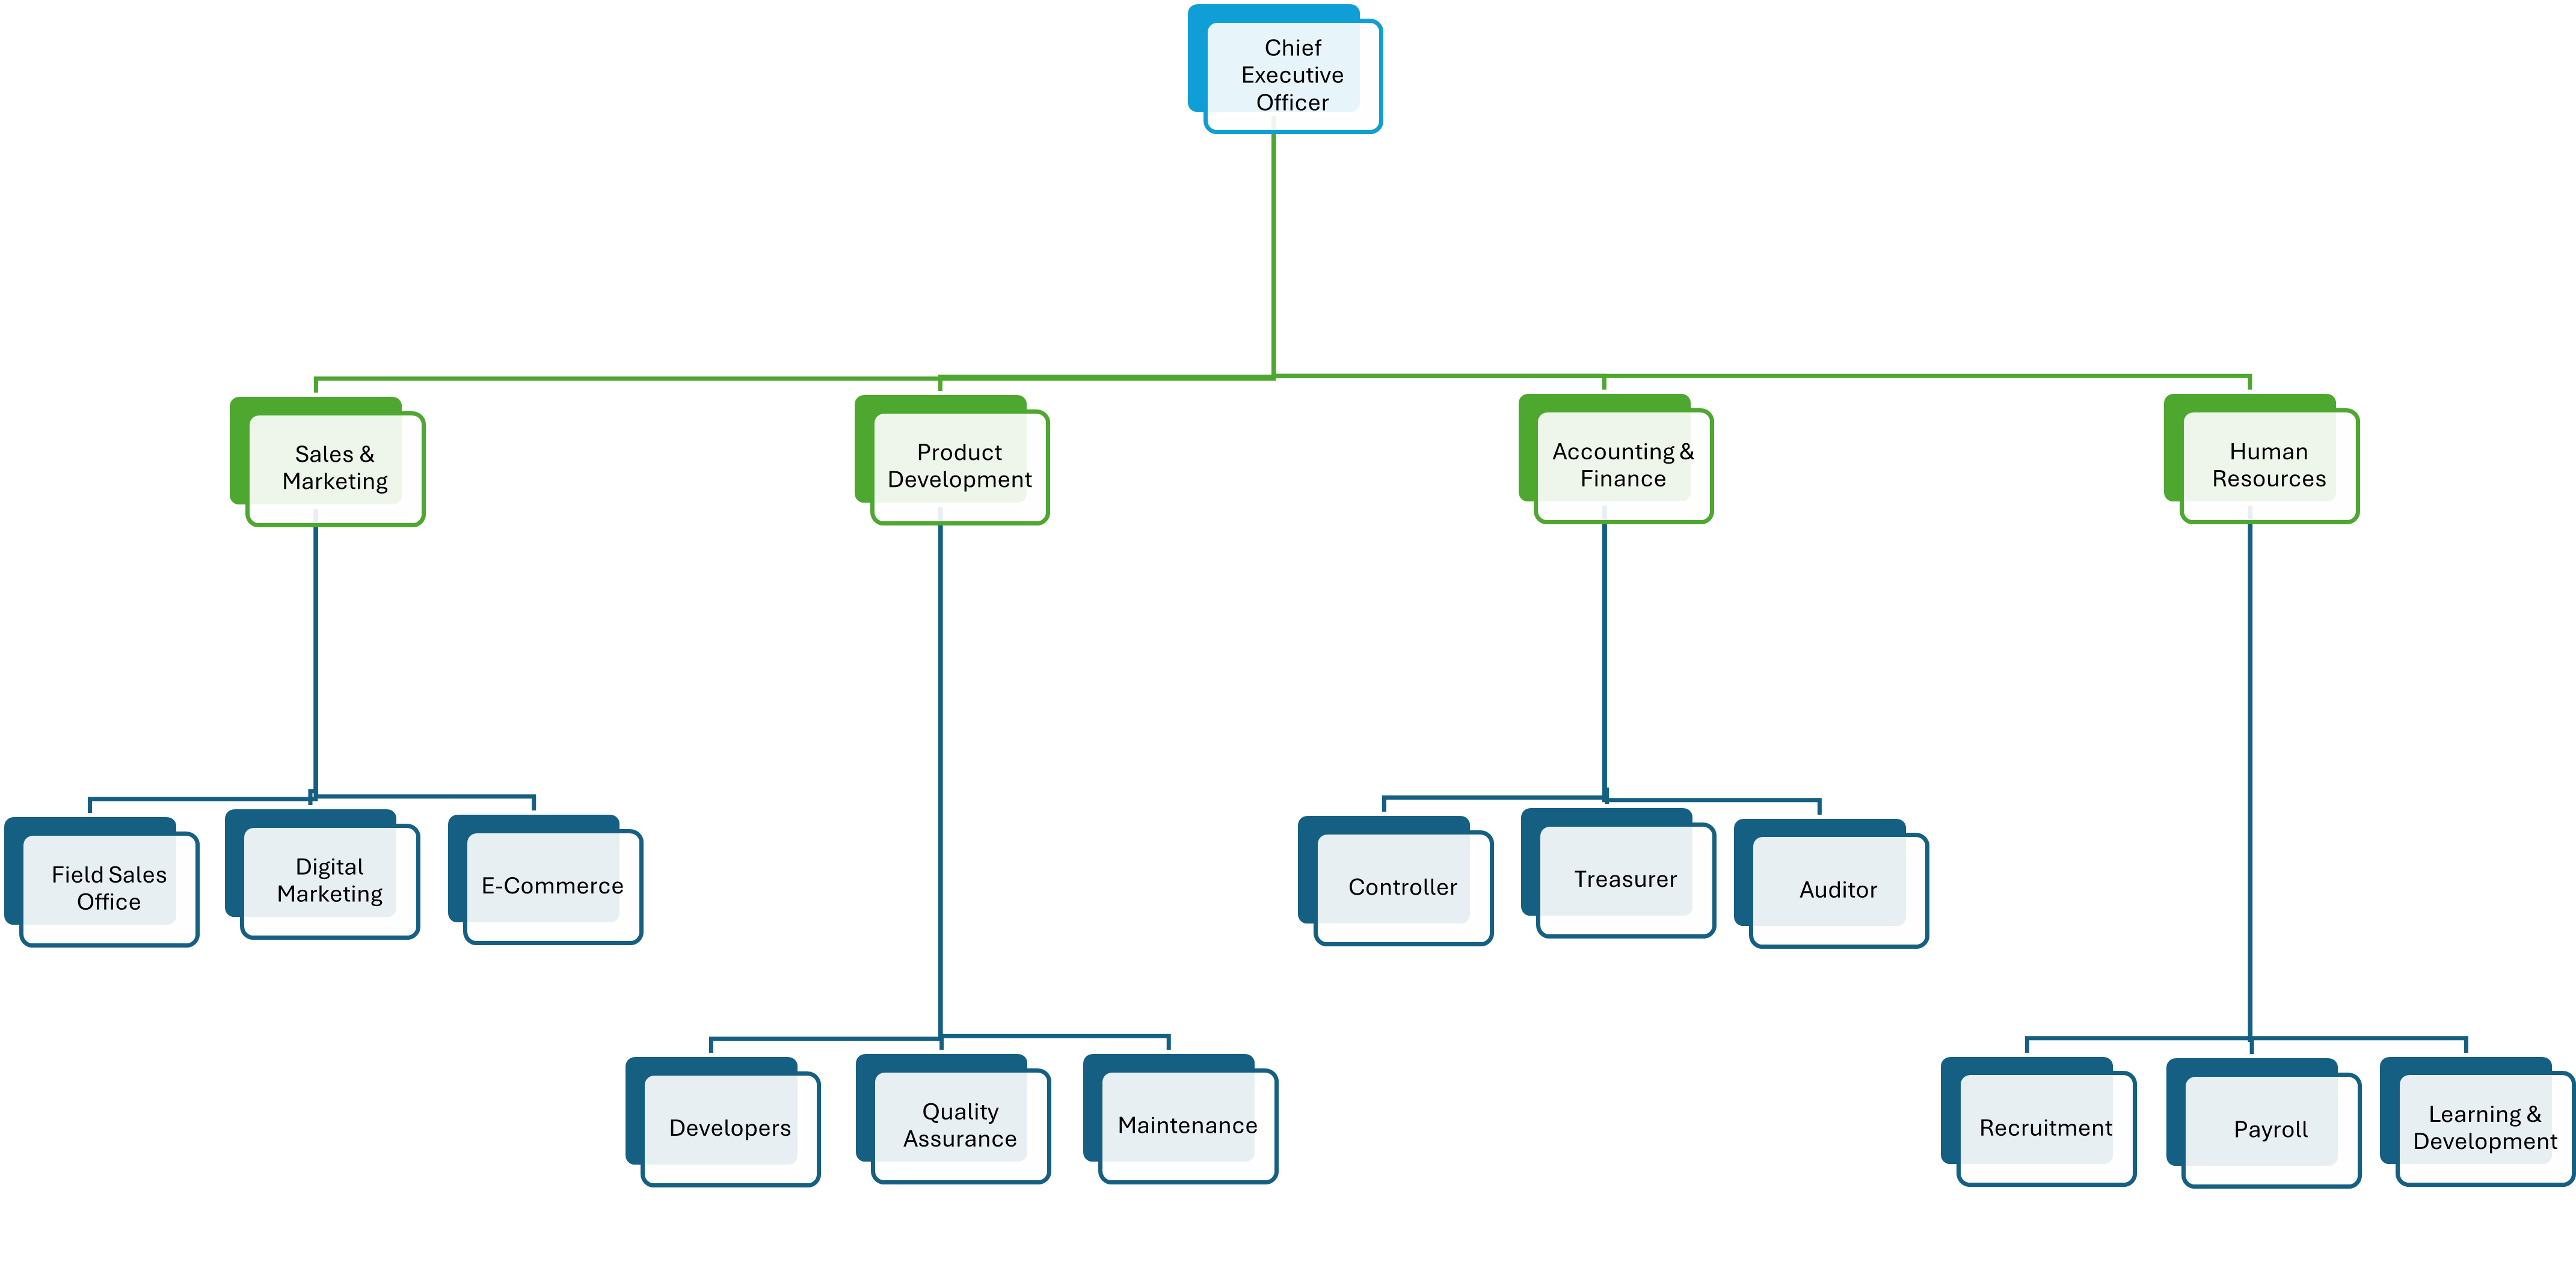
For this discussion, we will define a process as an ordered collection of activities for accomplishing a business function. The functional perspective of an organization views an organization as consisting of functional areas or departments, each with its own charge and hierarchy. Figure 1 shows the following functional areas: Sales & Marketing, Product Development, Accounting & Finance, and Human Resources.
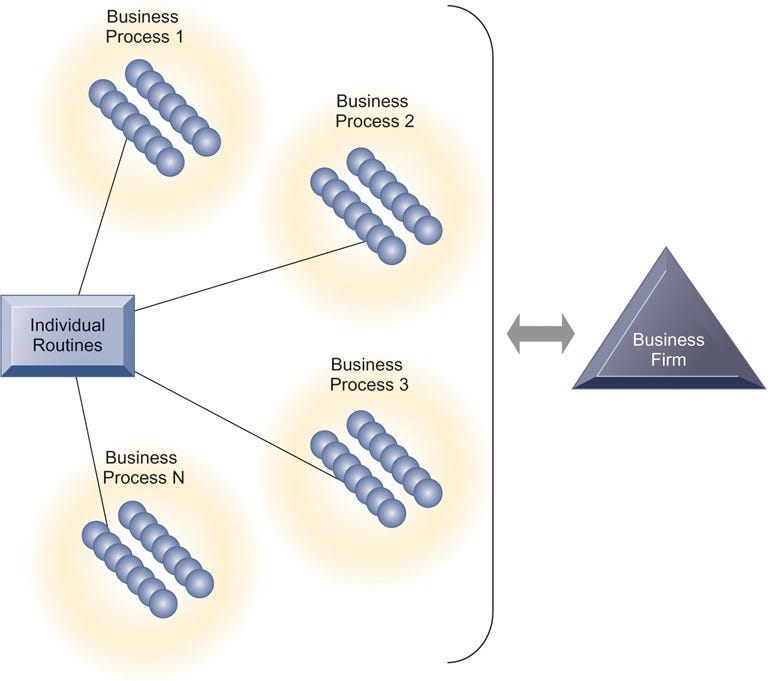
In contrast to and at times as an extension of the functional perspective of an organization, the process perspective views the organization as a collection of processes. What we’ve referred to above as activities, Laudon & Laudon describe as routines in a business firm, these routines help make up business processes. As shown in Figure 2 is a collection of business processes make up the business firm1.
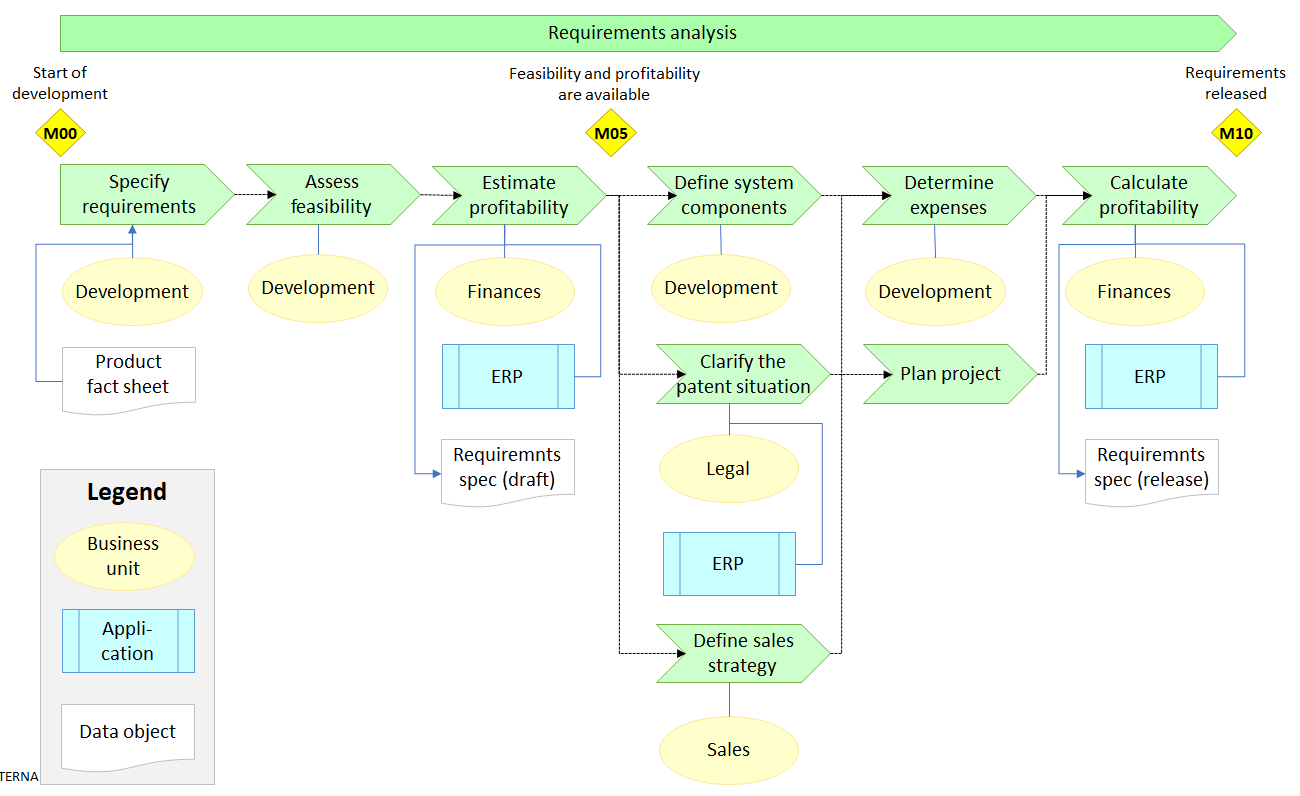
The processes often cut across the functional areas. Actors are people, departments or computer applications that work to complete an activity. Figure 3 shows the requirements analysis as a process with nine activities being completed by five actors2. Four of the actors are functional areas or business units, while the fifth is a computer application, the ERP system.
At the conclusion of this step your organization will have an inventory of all its main processes.
Step 2. Collect Data on your Processes
Processes consume resources – human resources, financial resources, time, and others. You need to gather data on the resource needs of each process. The best way to start this accounting is to focus on each activity in the process. For each activity, get data on the resources that it uses, sometimes estimates may need to be made. Chapter 7 of Oguz’s book on Project Management3 provides some activity duration estimation techniques.
For each process, you will want to note the cycle time, which is “the time taken from starting an assignment until ends, including any lingering times, holding times, or postponements.”4. You will also want to note how long it takes for decisions that alter the flow of the process take to be made and who/what triggers those decisions. Decisions can later be modeled using a decision modeling language, such as Decision Model and Notation (DMN)5.
Step 3. Model your Processes
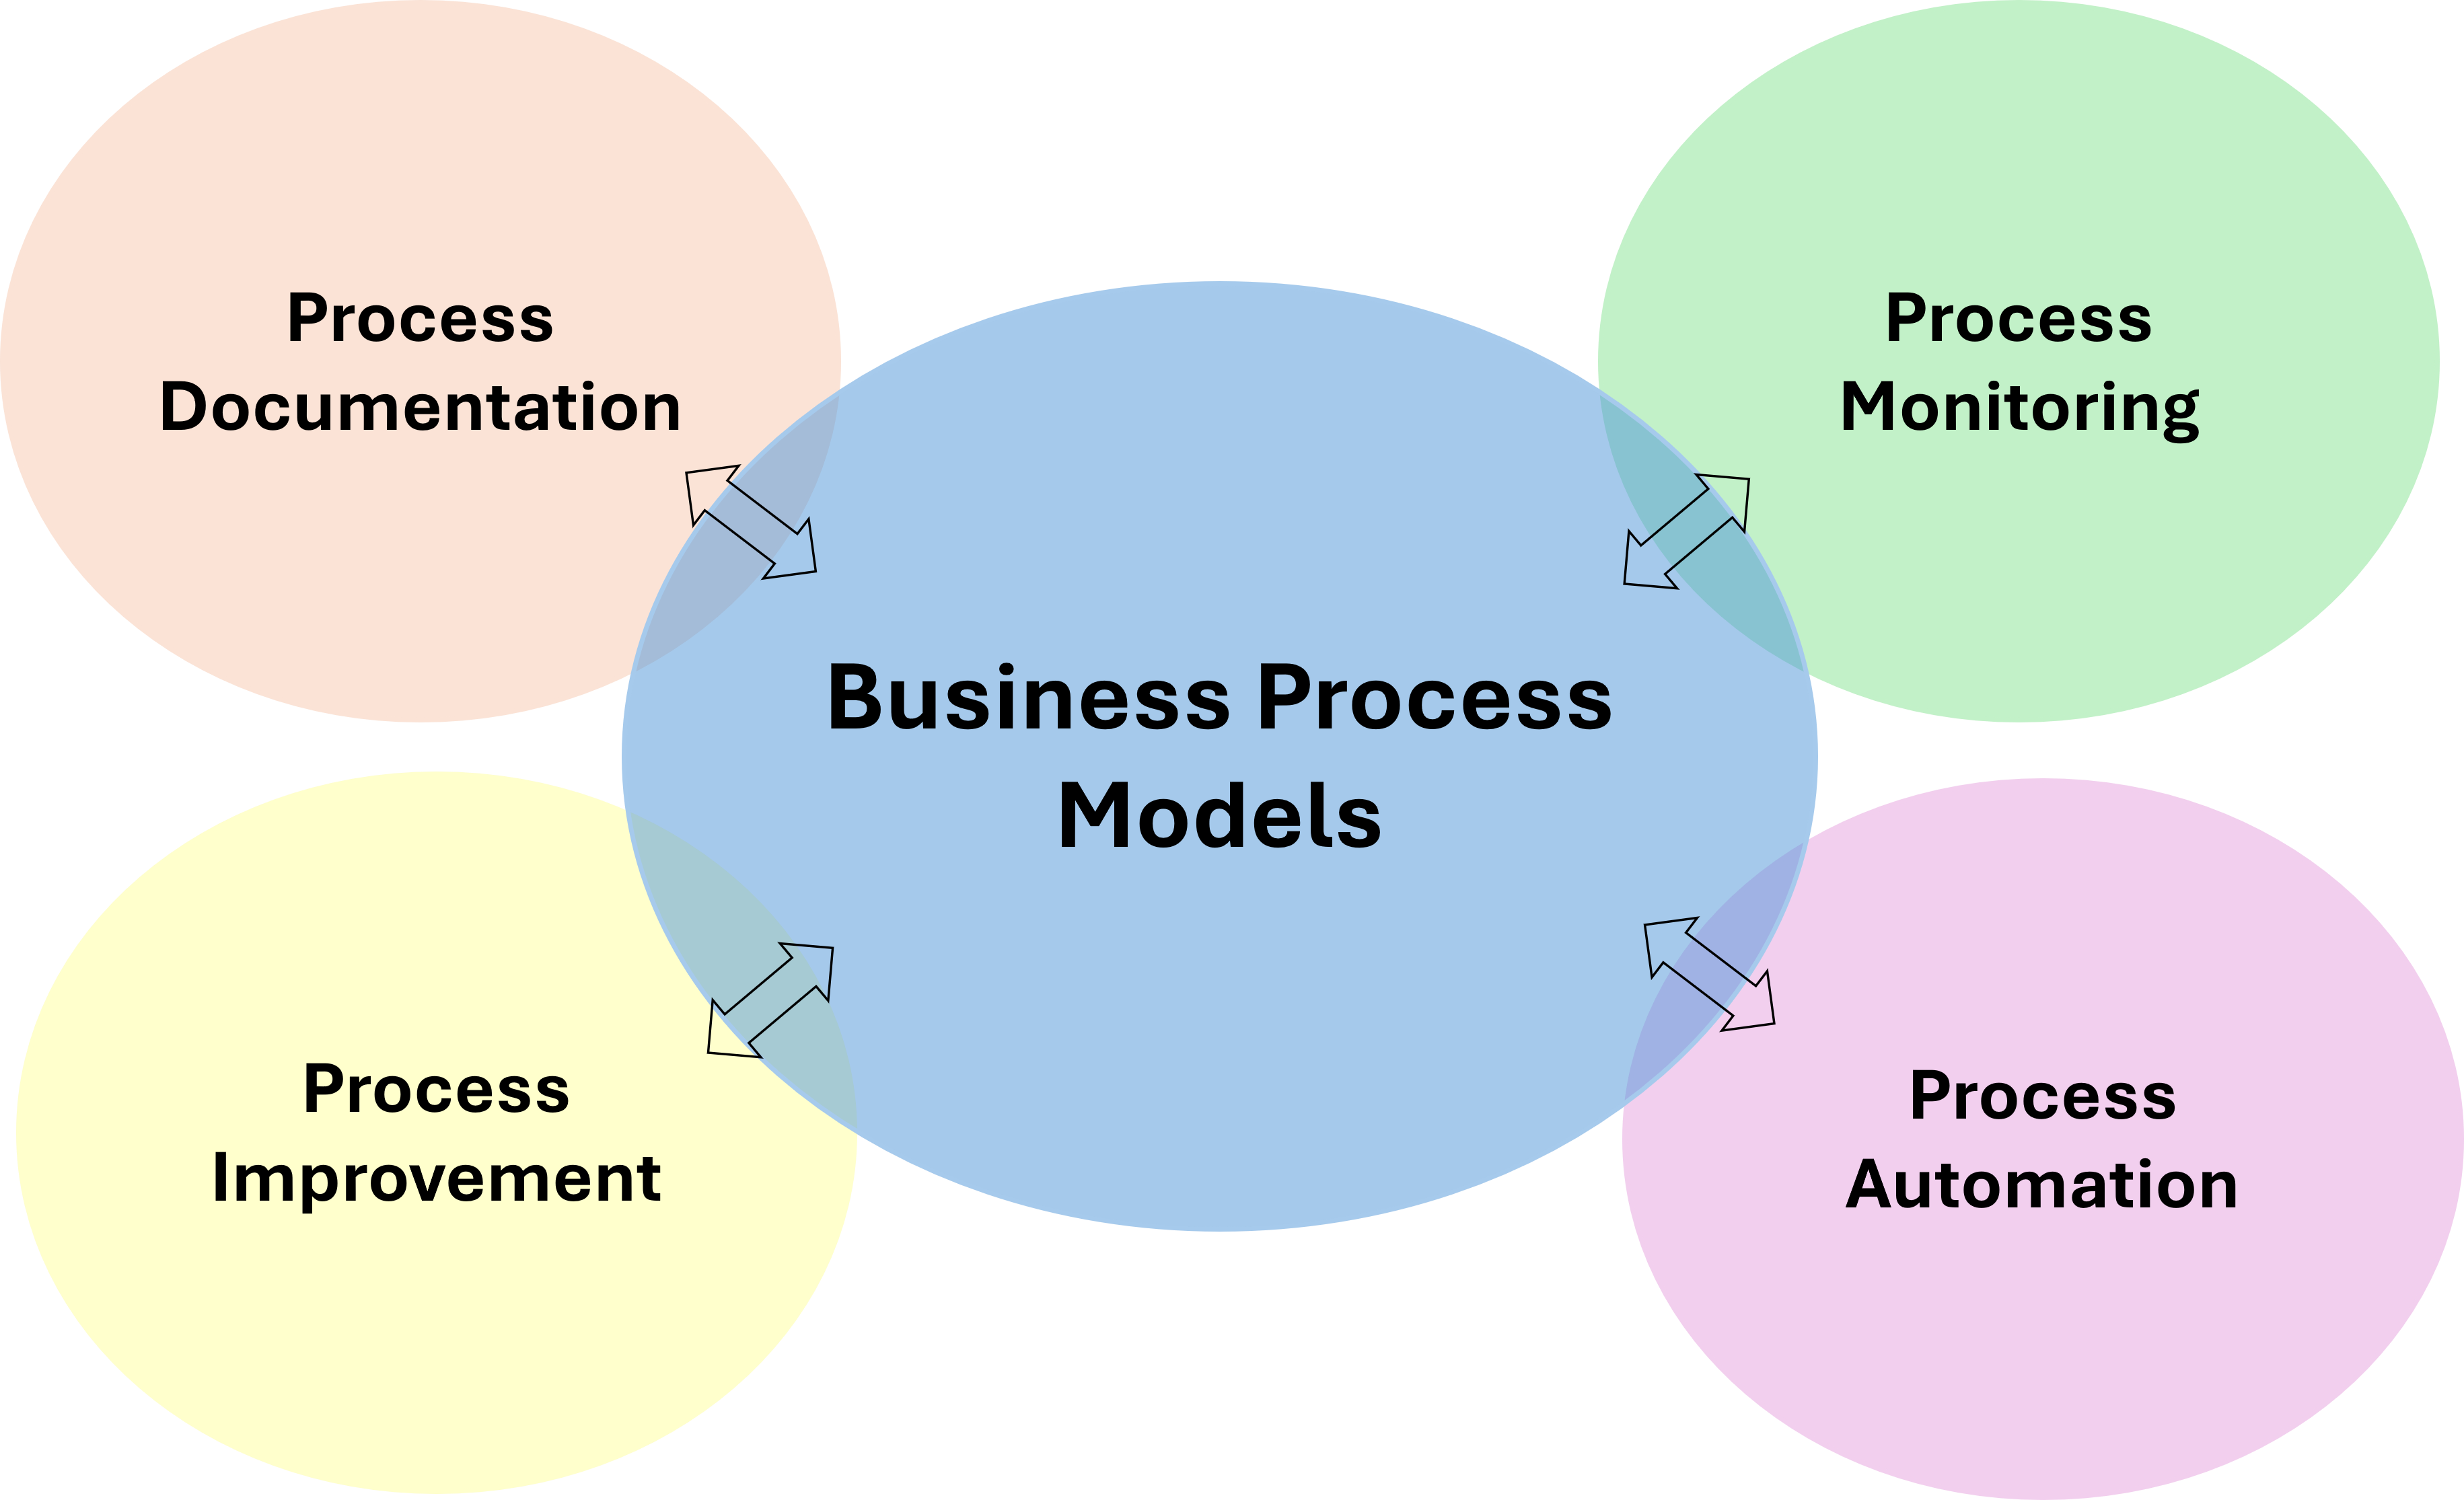
At the basic level, by modeling your processes we mean documenting the important details of each process. Process models form the basis for much of the analysis and other value-add actions that are performed on businesses processes. As shown in Figure 4 business process models may be used for process documentation, process monitoring, process improvement, and process automation6.
To get the modeling step done as quickly and painlessly as possible you first need to identify for each process the expert(s) in your organization, that is those who have a thorough understanding of the process. These experts will then be the primary sources for the data needed to model each process.
There are many ways to model processes, however here we will only discuss four methods. Each of the methods has pros and cons, we will not go into a detailed comparison of the methods. The modeling processes that we will discuss are:
Standard Operating Procedures (SOPs)
This method involves writing an instruction manual or a SOPs document which lists step-by-step instructions that need to be done to complete the process. An example of SOPs is a flight instructor’s manual which gives a pilot step-by-step instructions on what to do in each flight situation.
Flowcharts
The are diagrams, such as the one as shown in Figure 5, with labeled rectangular shapes with square edges representing activities, diamond shapes representing decisions, labeled rectangular shapes with round edges representing process start and end points, and lines ending with an arrow connecting the shapes representing the flow of control in the process7.
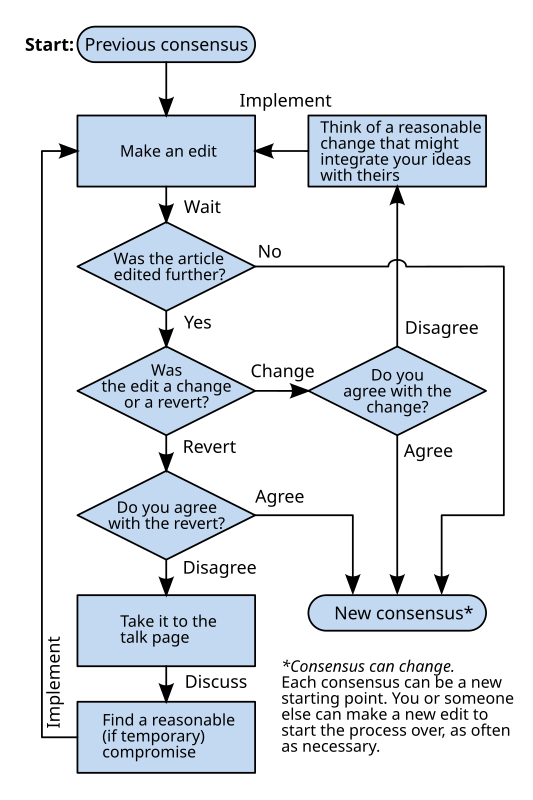
Figure 5. A flowchart modeling the process of reaching a consensus. [7] Petri Nets (PNs)
A Petri Net (PN) is a graph model for formally or mathematically describing the components of a system, as well as the logical interaction between these components. PNs can be used to describe complex systems, such as distributed systems that may exhibit concurrent or asynchronous behaviors in their operation. While PNs have been used extensively to model distributed systems, van Hee et al.8 and Medina-Garcia et al.9, along with several other researchers have published papers on how PNs can be used to model business processes as well. Figure 6 shows an example of a PN of a supply chain10.
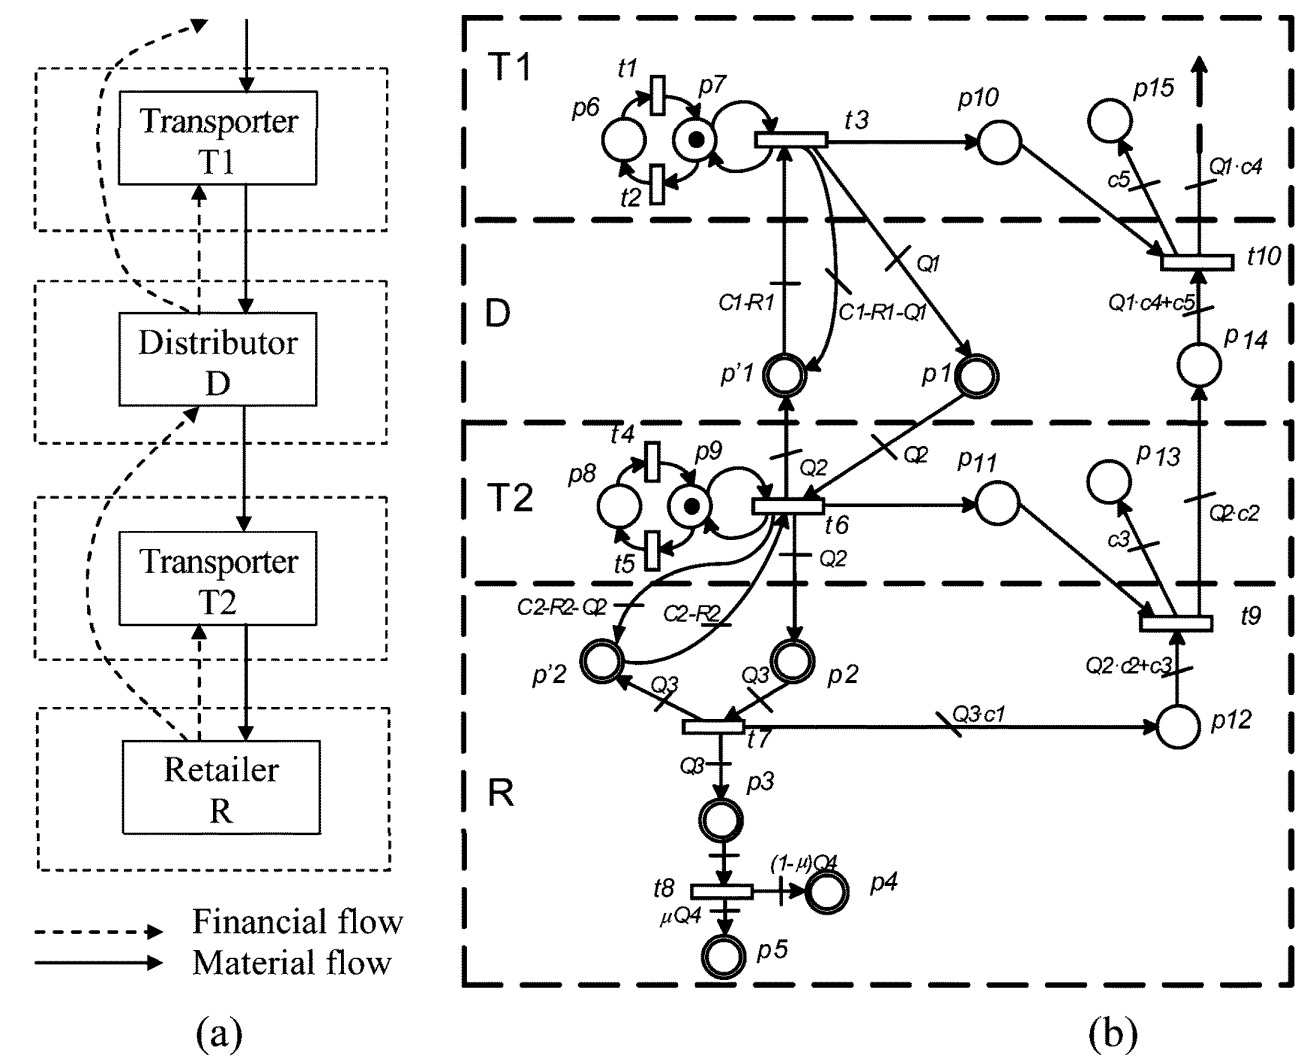
Figure 6. A set of (a) supply chain entities and (b) the corresponding first-order hybrid Petri Net model including the financial flow among such entities. [10] A major benefit of PNs is it is possible to formally verify a PN by proving that model and hence the system it represents behaves as intended, avoiding errors or undesirable effects. However, PNs require extensive training on the part of the modeler in order to be able to accurately model even the simplest business process.
Business Process Model & Notation (BPMN)
BPMN is a standard set of terms and graphical notations for documenting business processes. The standard is published by the Object Management Group.11 Figure 7 shows an example of a BPMN model of an order fulfillment process with annotations highlighted in red.12
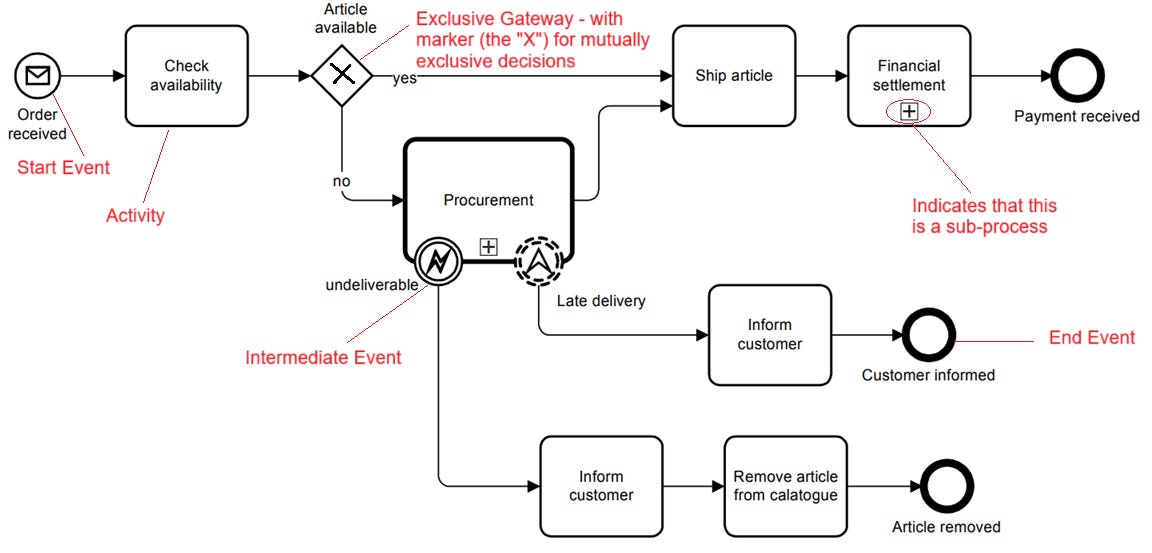
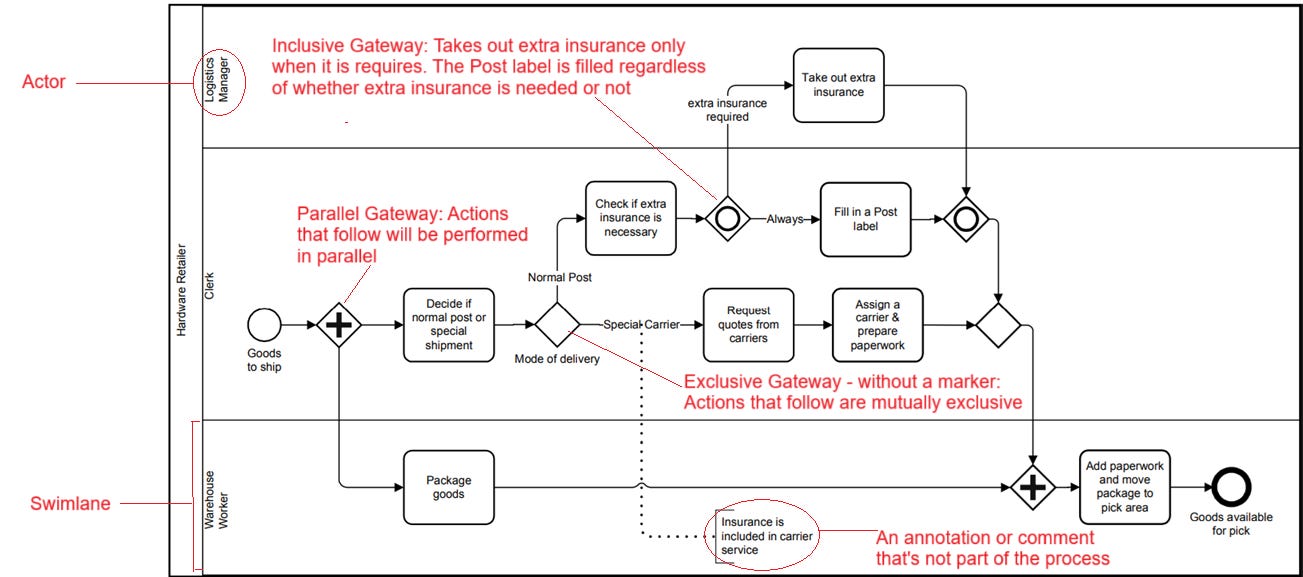
Figure 7. A BPMN model of an order fulfillment process [12]. The red annotations describe the functions of a shape. Figure 8 shows the BPMN model of a shipment process of a hardware retailer where three different actors are each assigned a swimlane.
BPMN is an expressive modeling language that is designed to be able to model most business processes. We highly recommend using BPMN to model your business processes in preparation for your RPA initiatives instead of any of the other modeling techniques.
Figure 8. A BPMN model of a shipment process of a hardware retailer [12]. The red annotations describe the functions of a shape. Several BPMN tools, such as SAP Signavio Process Manager and Camunda, allow you to add parameters (i.e. metrics from Step 2), such as activity time, activity costs, schedules to the activities in your model and resource costs and availability to your actors.


Once you have modeled your current business processes, that is your as-is processes, we will refer to the models as your as-is process model.
When business processes are properly modeled using BPMN an organization can receive the following benefits.
When business processes are modeled, they can more easily be standardized or made uniform across the different branches and units of the organization13 [13]. This helps the organization:
Enforce rules. The models may be used to train employees and help ensure that the same details about processes are passed along and followed. Furthermore, auditors and regulators when needed can review these rules to ensure that they are compliant with the regulations.
Provide consistent results because regardless of the actor playing a role in the process, the activities and decisions are performed in a consistent manner.
Allow for scalability. That is, the organization can replicate the process and implement it in new locations as an organization grows.
Reduce risk. For example, by reducing the potential for errors that may exist when different employees do the same activity differently.
2. BPMN models with simulation parameters, that is one where things like activity with the activity and resource metrics have been input may be simulated. The next step discusses simulations in a bit more detail.
Step 4. Simulate your Business Processes
Business process simulation is a technique that helps business analysts simulate the execution of business processes for studying the resource consumption (e.g., human resources, devices, etc.) throughout a process, identifying bottlenecks and improving the current business by process refinement and resources re-allocation.14 Based on simulations an as-is process model can be modified and tested to produce a to-be process model which can then be used to update the real process and minimize potential disruptions, and other process changes related risks.
Scenario:
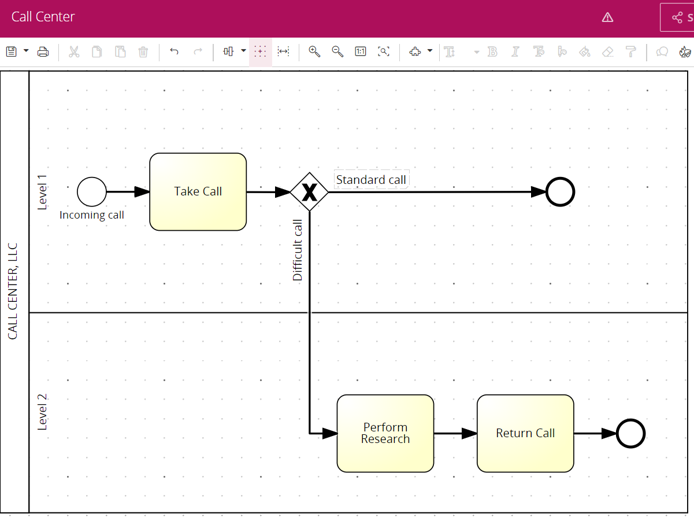
In this scenario we will model the customer support operations at a small call center. The objective is to find the appropriate staffing level for a given call volume. We will be modifying the model itself, as well as changing some parameters to reach the objective.
Help desk staff (Level 1 resource) make $8/hour, while support staff (Level 2 resource) make $12/hour.
75% of the calls taken can be resolved over the phone within the first 2 minutes. Once the question is answered, the call exits the system. But the remaining 25% of calls are more difficult and require additional research. The research function takes 20 minutes to complete. Following the research, the call must be returned to the customer. This return call takes 3 minutes.
New calls come into the call center every 5 minutes. Management has determined that the average customers with a difficult issue should not wait more than 60 minutes to receive a call back.This scenario is adapted from a process model tutorial by ProcessModel, Inc.15
Table 1 and Table 2 summarize the activity and resource input parameters for the process scenario described above.


We model the process using BMPN in SAP Signavio Process Manager as shown in Figure 9, this is the as-is process model.
We run the simulation in SAP Signavio Process Manager using the input parameters in Tables 1 and Table 2. We track five performance metrics: Level 1 resource, Level 2 resource utilization, average cycle time for the difficult calls, bottlenecked activity, and total cost of the process.
Table 3 shows the performance results for the original (as-is) model.

Clearly, we can see that management is right to be concerned about the current setup with this process, as callers who call with a difficult issue are getting a call back in about 11 hours (669.7 minutes) on average. We also have an underutilization of the Level 1 resource and an overutilization of the Level 2 resource.
We are going to create four different to-be models where for each to-be model we make only one change to the as-is model. The four to-be models are:
To-Be Model 1: Change Entity Handling / Modify the flow of control or data – When a Level 2 team member gets a call handed over from the Level 1 team (i.e. a difficult call), they gather the basic information and then hang up. They do not research the issue while the caller is on the line. (Get Research & Free, Return Call later)
To-Be Model 2: Change Responsibilities of Staff – Since the Level 1 resource is underutilized in the as-is model and there is a bottleneck in a activity that’s being completed by the overutilized Level 2 resource, in this model we re-assign the Return Calls activity to the Level 1 resource.
To-Be Model 3: Hire More Staff - Since the Level 2 resource is overutilized in the as-is model and there is a bottleneck in a activity that’s being completed by this resource, in this model we increase the number of Level 2 resources from 1 to 2.
To-Be Model 4: Cross-Train Staff – In this model we cross-train the Level 1 resource to be able to do the Perform Research activity and assign then to assist with the Perform Research activity when there is a low volume in the Take Call activity. Their priority will be to take a call as soon as one arrives, so if there were in the middle of a Perform Research activity, they would pause it and immediately answer the call and then return working on the Perform Research activity when the call volume is low again.
Next, we will run simulations of the four to-be process models and record the five KPIs for each model. Table 4 shows the performance of each to-be model alongside the as-is model.

Analysis of the Multi-Model Simulation Results
We analyze the results to see if any of the to-be models improves upon the as-is model and if it allows us to meet management’s requirements. If more than one to-be model meets the management’s requirement we will then search for the optimal one. From the results in Table 4, we observe that all the to-be models perform better than the as-is model with regards to the average cycle time, but they are all worse with regards to the total cost.
Both To-Be Model 3 and To-Be Model 4, with average cycle times of 38.75 minutes and 53.96 minutes, respectively meet management’s requirement that customers calling in with a difficult issue should have their issue researched and get a call back within 60 minutes. Next, we look at the other KPIs to determine which of these two models is optimal.
Nicole Tiefensee16 and others recommend an optimal resource utilization rate is 70-80%. Based on these recommendations, only To-Be Model 4 is optimal from a resource utilization-perspective. Looking at the total process cost we see that To-Be Model 3 is 96.9% more expensive than the as-is model, while To-Be Model 3 is only 32.7% more expensive than the as-is model. So, from a total cost perspective To-Be Model 3 is the preferred model. Based on the lower total process cost and better optimal resource utilization rate, that falls within the accepted industry guideline, we select To-Be Model 3 as the one that should be selected for implementation to best meet management’s requirement for improving the call center process.
This scenario analysis shows how BPMN business process models can be created and simulated to help understand the current performance of a business process, facilitate the generation of potential updates to the process, simulate and evaluate the performance of the potential updates, and determine if any of these potential updates should be recommended for implementation to improve the process. Translating Apple’s position on failure from Tim Cook, Apple’s CEO who said “We do allow ourselves to fail. We try to fail internally, instead of externally, because we don’t want to involve customers into failure. But we develop things and subsequently decide not to ship”,17 to the impact of BPMN modeling and process simulations in helping organizations mitigate against failed business process improvement initiatives. By using BPMN modeling and process simulations, management can see through this data-driven approach those businesses processes that will fail to scale in the simulations and only introduce into production optimal business processes that they are confident will succeed.
Conclusion
The journey to a successful RPA implementation on an enterprise-level is built on a foundation of modeling, inventorying, and simulation of the organization’s business processes so that management can gain a full understanding of where the inefficiencies and bottlenecks in the organization’s business processes lie. It is only when management has this data that they can decide on how to strategically introduce RPA at-scale within the organization. In this article we provided a step-by-step guide on how to lay this foundation.
Kenneth C. Laudon & Jane P. Laudon, Management Information Systems, Pearson, 14th Edition, pp. 85, 2016.
Wikipedia contributors. (2025, March 24). Business process modeling. In Wikipedia, The Free Encyclopedia. Retrieved 12:13, April 7, 2025, from https://en.wikipedia.org/w/index.php?title=Business_process_modeling&oldid=1282099799
Abdullah Oguz, “Chapter 7: Estimating Activity Durations” in Project Management: Navigating the Complexity with a Systematic Approach, 10 October, 2022, MSL Academic Endeavors. https://pressbooks.ulib.csuohio.edu/project-management-navigating-the-complexity/chapter/7-3-estimating-activity-durations/
Understanding Cycle Time: Definition, Calculation, and Importance, 20 May 2024. https://www.6sigma.us/manufacturing/cycle-time/
Decision Model and Notation. https://www.omg.org/dmn/
Simulating Business Processes, BPMN Meets DMN: Business Process and Decision Modeling: An openHPI Course by Mathias Weske. https://open.hpi.de/courses/bpm2016
A flowchart of how consensus is reached. In Wikipedia, The Free Encyclopedia. Retrieved 12:13, April 9, 2025, from https://en.m.wikipedia.org/wiki/File:Consensus_Flowchart.svg#/media/File:Consensus_new_and_old.svg
van Hee, K.M., Sidorova, N., van der Werf, J.M. (2013). Business Process Modeling Using Petri Nets. In: Jensen, K., van der Aalst, W.M.P., Balbo, G., Koutny, M., Wolf, K. (eds) Transactions on Petri Nets and Other Models of Concurrency VII. Lecture Notes in Computer Science, vol 7480. Springer, Berlin, Heidelberg. https://www.researchgate.net/publication/265885200_Business_Process_Modeling_Using_Petri_Nets
Medina-Garcia, S., Medina-Marin, J., Montaño-Arango, O., Gonzalez-Hernandez, M., & Hernandez-Gress, E. S. (2023). A Petri Net Approach for Business Process Modeling and Simulation. Applied Sciences, 13(20), 11192. https://doi.org/10.3390/app132011192
Mariagrazia Dotoli, Maria Pia Fanti, Giorgio Iacobellis, and Agostino Marcello Mangini (2009). A First-Order Hybrid Petri Net Model for Supply Chain Management. IEEE Transactions on Automation Science and Engineering, vol. 6, no. 4, pp.744–758, 2009. https://doi.org/10.1109/TASE.2009.2021362 (paywalled article)
Object Management Group, Business Process Model and Notation. https://www.bpmn.org/
Object Management Group. BPMN 2.0 by Example, June 2010. OMG Document Number: dtc/2010-06-02. http://www.omg.org/spec/BPMN/2.0/examples/PDF
McKinney Jr, E. H., & David, M. (2019). Processes, systems, and information: An introduction to MIS. Pearson, 3rd Edition, pp. 28-29.
Visual Paradigm, BPMN Process Simulation Example, https://www.visual-paradigm.com/tutorials/process-simulation-example.jsp
ProcessModel Inc., Lesson 1: Your First Model, https://www.processmodel.com/help/lesson-1-your-first-model/
Nicole Tiefensee, Why Resource Utilization Should Be Part of Your KPIs, Runn Blog, Jan 17, 2025. https://www.runn.io/blog/resource-utilization#the-optimal-level-of-resource-utilization
Jason Aten, Tim Cook Just Explained a Brutal Truth About Failure That Most People Never Acknowledge Success isn’t the opposite of failure, Inc., Jun. 17, 2021. https://www.inc.com/jason-aten/tim-cook-just-explained-a-brutal-truth-about-failure-that-most-people-never-acknowledge.html